The top command in Linux is a fundamental tool for monitoring processes, providing real-time insights into system performance based on criteria like CPU and memory usage. This command generates a list of processes with detailed information such as procedure name, PID, user, CPU usage, and memory usage.
Beyond displaying a comprehensive list of processes, top also presents concise statistics at the top of the display, showcasing average system load, CPU usage, and RAM usage.
Widely recognized as a vital resource for system administrators, the top command comes pre-installed on every Linux distribution. Its interactive nature allows users to navigate through the process list and perform actions like killing processes, distinguishing it from non-interactive alternatives like ps.
- 1) Running the command with No options
- 2) Getting the help for top command
- 3) How to quit the top command?
- 4) How to check the version of top?
- 5) Going through the column heading of the top command
- 6) Display processes for a Particular User
- 7) Sort by Memory/Cpu/Process ID/Running Time
- 8) How to Reverse the sorting order
- 9) Set Interval for Refreshing the Display
- 10) How to kill the process?
- 11) How to sort by columns using top command
- 12) See Processes for a Single User
- 13) How to only see active tasks?
- 14) View the Absolute Path of processes
- 15) Automatically Exit top Controller after a Particular Number of Refreshes
- 16) Best Practices for Using the Top Command in Linux:
- 17) FAQs – Using the Top Command in Linux:
- 18) Wrapping Up Top Command
- 19) You may also like to learn:
Running the command with No options
$ top
An example output:

Getting the help for top command
The top command help will provide you a list of alternatives you can use to customize the output and the functions you can perform when you’re operating the top command.
In order to get the help while still the top command is running, press the ‘h’ key:

How to quit the top command?
After executing the top command, you may simply press the ‘q’ button to quit this. If you press ‘q’ after above help command, it will quit help. Again press ‘q’ to quit top.
How to check the version of top?
To check which version of top you have, type the following command:
$ top –v
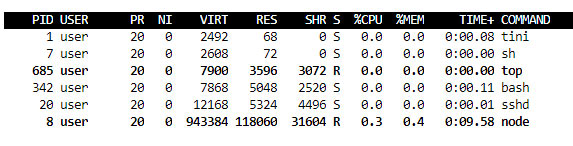
Going through the column heading of the top command
The column headings in the process list are as follows:
| PID | Process ID |
| USER | The owner of this process. |
| PR | Process priority |
| NI | The process nice value |
| VIRT | Number of virtual memory used by the process. |
| RES | Number of resident memory used by the process. |
| SHR | Number of memory used by the process. |
| S | Status of this process. |
| % CPU | The share of CPU time used by the process since the last upgrade |
| %MEM | The share of physical memory used. |
Display processes for a Particular User
If you want the top command to display processes being conducted by a specific user, you can use the following syntax:
$ top -u [username]
For example, the following command will display all of the processes being run by root:
$ top -u root
Sort by Memory/Cpu/Process ID/Running Time
To obtain the process consuming the most CPU or memory, only type the list.
Press the capital ‘M’ key to sort the process list by memory usage. Processes with the most memory are shown first and rest in order.
Here are additional options to sort by CPU usage, Process ID, and Running Time –
- Press ‘P‘ – sorted by CPU usage.
- Press ‘N’ – for sorting by process id.
- Press ‘T’ – to sort from the running time.
How to Reverse the sorting order
By default, the sorting is done in descending order. Pressing ‘R’ shall reverse the sorting order of the currently sorted column
This is the output sorted in ascending order of CPU usage. Processes consuming the least amount of CPU are shown first. An example output is shown below:
Set Interval for Refreshing the Display
By default, the top command output is refreshed every 3 seconds. To be able to change this period, hit the ‘d’ key while the top command is operating.
You may then enter the new time, in seconds, and the newest output is refreshed on the screen.
How to kill the process?
If you would like to kill a process, simply press ‘k’ when the top is running. This will bring up a prompt, which will request the process ID of the process and press enter.
Next, input the sign using which the procedure ought to be killed. If you leave this blank, the top utilizes a SIGTERM, which enables processes to terminate gracefully. If you wish to kill a process successfully, you can type in SIGKILL here. You may also type in the sign number here. By way of instance, the amount for SIGTERM is 15 and SIGKILL is 9.
How to sort by columns using top command
By default, the processes list is sorted by the %CPU column. You can change the sort column by pressing on the following:
- P: The %CPU column.
- M: The %MEM column.
- N: The PID column.
- T: The TIME+ pillar.
See Processes for a Single User
Press “u” to find the processes for one user. You’ll be prompted for the name or UID
Type the title of the UID of the person you want to track.
How to only see active tasks?
Press I to see only active tasks.
View the Absolute Path of processes
If you would like to observe the complete path of the running processes, hit the ‘c’ key while the top command is operating. In the following output, you can see that the command now shows the path of the running processes in the Control column:

Automatically Exit top Controller after a Particular Number of Refreshes
As stated earlier, you can stop the top command manually via ‘q’ or ctrl+c. If you want the top command to run until a specific number of output refreshes, you can use the following command:
$ top –n5
The top command should exit after five refreshes.
Best Practices for Using the Top Command in Linux:
- Basic Execution:
- Run the top command without any options to get a quick overview of system processes.
$ top
- Run the top command without any options to get a quick overview of system processes.
- Accessing Help:
- Press ‘h’ while the top command is running to access a list of options and commands for customization.
$ top
- Press ‘h’ while the top command is running to access a list of options and commands for customization.
- Quitting the Top Command:
- Exit the top command by pressing ‘q.’ If accessing help, press ‘q’ twice to exit.
$ top
- Exit the top command by pressing ‘q.’ If accessing help, press ‘q’ twice to exit.
- Checking Version:
- Determine the version of the top command in use.
$ top -v
- Determine the version of the top command in use.
- Column Headings:
- Understand the meanings of column headings in the process list for effective monitoring.
- PID: Process ID
- USER: Owner of the process
- % CPU: CPU usage by the process
- %MEM: Physical memory usage
- Understand the meanings of column headings in the process list for effective monitoring.
- Filtering Processes by User:
- Display processes for a specific user using the ‘-u’ option.
$ top -u [username]
- Display processes for a specific user using the ‘-u’ option.
- Sorting Processes:
- Sort processes by memory, CPU usage, process ID, or running time for better analysis.
- Press ‘M’ for memory usage.
- Press ‘P’ for CPU usage.
- Press ‘N’ for sorting by process ID.
- Press ‘T’ for sorting by running time.
- Sort processes by memory, CPU usage, process ID, or running time for better analysis.
- Reversing Sorting Order:
- Reverse the sorting order of the current column by pressing ‘R.’
$ top
- Reverse the sorting order of the current column by pressing ‘R.’
- Setting Refresh Interval:
- Change the refresh interval of the top command for real-time updates.
- Press ‘d’ and enter the desired interval in seconds.
- Change the refresh interval of the top command for real-time updates.
- Process Termination:
- Kill a process interactively by pressing ‘k’ and entering the process ID and signal type (e.g., SIGTERM or SIGKILL).
- Changing Sort Columns:
- Switch between sort columns to focus on different aspects of the processes.
- Press ‘P’ for %CPU.
- Press ‘M’ for %MEM.
- Press ‘N’ for PID.
- Press ‘T’ for TIME+.
- Switch between sort columns to focus on different aspects of the processes.
- Viewing Processes for a Single User:
- Press ‘u,’ and you’ll be prompted to enter the username or UID for displaying processes of a specific user.
- Displaying Active Tasks Only:
- Press ‘I’ to filter and display only active tasks.
$ top
- Press ‘I’ to filter and display only active tasks.
- Viewing Absolute Path of Processes:
- Press ‘c’ to show the absolute path of running processes in the COMMAND column.
$ top
- Press ‘c’ to show the absolute path of running processes in the COMMAND column.
- Automated Exit After Refreshes:
- Specify the number of refreshes before the top command automatically exits.
$ top -n5
- Specify the number of refreshes before the top command automatically exits.
Adjust the number (5 in this example) based on your preference.
FAQs – Using the Top Command in Linux:
- Why use the top command in Linux?
- The top command is essential for monitoring processes, providing real-time insights into CPU and memory usage, making it a crucial tool for system administrators.
- How to run the top command with no options?
- Execute the following command:
$ top
- Execute the following command:
- How to access help for the top command?
- Press ‘h’ while the top command is running to view a list of options and functions.
$ top
- Press ‘h’ while the top command is running to view a list of options and functions.
- How to quit the top command?
- Simply press ‘q’ to exit. Pressing ‘q’ again quits the help menu if opened during runtime.
$ top
- Simply press ‘q’ to exit. Pressing ‘q’ again quits the help menu if opened during runtime.
- How to check the version of the top command?
- Use the following command:
$ top -v
- Use the following command:
- What are the column headings in the top command process list?
- Key column headings include PID, USER, % CPU, %MEM, and others, providing crucial information about running processes.
$ top
- Key column headings include PID, USER, % CPU, %MEM, and others, providing crucial information about running processes.
- How to display processes for a specific user?
- Use the ‘-u’ option followed by the username:
$ top -u [username]
- Use the ‘-u’ option followed by the username:
- How to sort processes by memory, CPU, process ID, or running time?
- Press ‘M’ for memory, ‘P’ for CPU, ‘N’ for process ID, and ‘T’ for running time.
$ top
- Press ‘M’ for memory, ‘P’ for CPU, ‘N’ for process ID, and ‘T’ for running time.
- How to reverse the sorting order in top command?
- Press ‘R’ to reverse the current sorting order.
$ top
- Press ‘R’ to reverse the current sorting order.
- How to set the refresh interval for the top command display?
- Press ‘d,’ enter the desired interval in seconds, and observe real-time updates.
$ top
- Press ‘d,’ enter the desired interval in seconds, and observe real-time updates.
- How to kill a process using the top command?
- Press ‘k,’ enter the process ID, and specify the signal type (e.g., SIGTERM or SIGKILL).
$ top
- Press ‘k,’ enter the process ID, and specify the signal type (e.g., SIGTERM or SIGKILL).
- How to sort processes by columns using the top command?
- Press ‘P’ for %CPU, ‘M’ for %MEM, ‘N’ for PID, and ‘T’ for TIME+.
$ top
- Press ‘P’ for %CPU, ‘M’ for %MEM, ‘N’ for PID, and ‘T’ for TIME+.
- How to view processes for a single user?
- Press ‘u,’ and enter the username or UID when prompted.
$ top
- Press ‘u,’ and enter the username or UID when prompted.
- How to see only active tasks in the top command?
- Press ‘I’ to filter and display only active tasks.
$ top
- Press ‘I’ to filter and display only active tasks.
- How to view the absolute path of processes in the top command?
- Press ‘c’ to display the absolute path of running processes in the Control column.
$ top
- Press ‘c’ to display the absolute path of running processes in the Control column.
- How to automatically exit the top command after a specific number of refreshes?
- Use the following command, where ‘n5’ indicates the top command will exit after five refreshes.
$ top -n5
- Use the following command, where ‘n5’ indicates the top command will exit after five refreshes.
Wrapping Up Top Command
In conclusion, the top command stands out as an essential tool for monitoring processes and system resource usage in Linux. As a fundamental command, it provides a real-time overview of the top processes, offering insights into CPU and memory usage.
Throughout this tutorial, we explored various aspects of the top command, from its basic usage to advanced functionalities:
- Introduction to Top Command:
- Identified as a fundamental command for process monitoring.
- Lists processes with detailed information such as procedure name, PID, user, CPU usage, and memory usage.
- Interactive Features:
- Allows users to navigate through the process list interactively.
- Differentiates itself from non-interactive alternatives like ps.
- Key Commands and Options:
- Demonstrated basic execution with no options:
$ top. - Explored the help command (
h) for a comprehensive list of options. - Learned how to check the version of top:
$ top –v.
- Demonstrated basic execution with no options:
- Understanding Process Information:
- Examined column headings, including PID, USER, PR, VIRT, RES, SHR, S, % CPU, and %MEM.
- Explored displaying processes for a specific user and sorting by various criteria.
- Advanced Functions:
- Explored sorting options by CPU usage, Memory, Process ID, and Running Time.
- Discussed how to reverse the sorting order (
Rkey). - Learned to set the refresh interval for display (
dkey).
- Process Management:
- Explored killing processes interactively with the
kkey. - Introduced sorting columns by CPU, Memory, PID, and Time (
P,M,N,Tkeys).
- Explored killing processes interactively with the
- Additional Features:
- Explored viewing active tasks only (
Ikey). - Revealed the absolute path of running processes (
ckey). - Demonstrated the automatic exit after a specified number of refreshes (
top –n5).
- Explored viewing active tasks only (
Mastering the top command enhances a system administrator’s capabilities, making it a go-to tool for efficiently managing Linux processes and resources. The interactive nature and powerful features make it an indispensable asset in the Linux toolbox.